
INDUSTRY NEWS
| August 16, 2026
| Global EV Charging Infrastructure
The global public electric-vehicle charging network expanded by more than one-third in 2025, pushing the worldwide total above seven million charging points as deployment increasingly shifts toward higher-power fast and ultra-fast infrastructure.
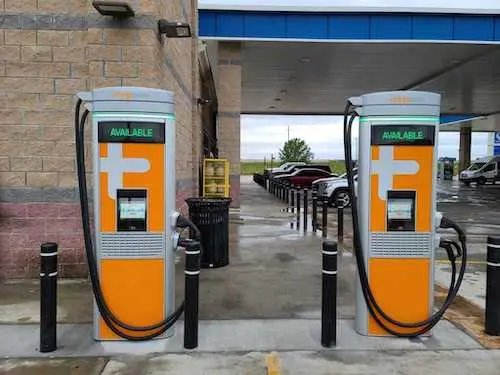
Image source: U.S. Department of Energy, Alternative Fuels Data Center (AFDC).
View original source.
IEA data: Nearly 1.8 million public charging points were added worldwide during 2025, taking the global stock above 7 million by the end of the year.
OFFICIAL IEA DATA · GLOBAL EV OUTLOOK 2026
7 million+ public charging points worldwide
Nearly 1.8 million added during 2025
More than 33% year-on-year global growth
Approximately 50 kW global average rated public charging power
Source:
International Energy Agency — Global EV Outlook 2026, Electric Vehicle Charging
.
Public charging recorded another year of rapid expansion
The International Energy Agency’s Global EV Outlook 2026 shows that public EV charging deployment accelerated again during 2025.
Nearly 1.8 million public charging points were added to the global network during the year.
That represented growth of more than 33% compared with the previous year and took the worldwide stock of public charging points above seven million by the end of 2025.
The growth broadly kept pace with the expansion of the global electric light-duty vehicle fleet.
According to the IEA, there were approximately 11 electric light-duty vehicles for every public charging point worldwide in 2025, similar to the ratio recorded in 2024.
Charging capacity is becoming as important as charger count
The number of installed charging points is only one measure of charging-network capacity.
Higher-power chargers can deliver more electricity within a given period and can therefore serve a larger volume of charging demand than low-power units, assuming vehicles can accept the available power.
The IEA estimates that public charging capacity averaged approximately 4.5 kW for every electric light-duty vehicle worldwide at the end of 2025.
It also reports that the average rated power of public charging points increased by approximately 15% during the year.
Average rated power rose from just over 40 kW in 2024 to nearly 50 kW in 2025.
The shift reflects faster growth in fast and ultra-fast public charging infrastructure compared with slower public charging.
Official IEA chart
The International Energy Agency publishes the underlying chart,
“Global stock of public charging points by speed, 2020–2025.”
The IEA chart is licensed under CC BY 4.0 and classifies public charging points as slow, fast and ultra-fast.
China remains the world’s largest public charging market
China continued to account for the majority of public EV charging infrastructure worldwide at the end of 2025.
According to the IEA, China represented more than 65% of global public charging points.
Its public network expanded from nearly 3.4 million charging points at the end of 2024 to more than 4.7 million at the end of 2025.
That growth represented more than three-quarters of the global increase in public charging points during the year.
China also continued to expand higher-power infrastructure.
The country’s stock of fast and ultra-fast public charging points increased by around 40%, from approximately 1.5 million in 2024 to 2.2 million in 2025.
The estimated average rated power of China’s public charging network exceeded 55 kW, higher than the global average of approximately 50 kW.
Europe added more public charging infrastructure
Europe’s public charging network also continued to grow during 2025.
The IEA estimates that the number of public charging points in Europe increased by around 20%.
Within the European Union, Denmark, Estonia, Latvia, Lithuania and Romania each recorded public charging-network growth above 50%.
The Netherlands remained Europe’s largest national public charging market at the end of 2025, with approximately 210,000 public charging points.
Germany followed with approximately 196,000, while France had around 185,000.
The IEA reports an average of approximately 11 EVs for every public charging point in the European Union, close to the global average.
Ultra-fast charging continues to expand in Europe
European public charging growth is increasingly accompanied by higher-power infrastructure.
The IEA reports that the number of ultra-fast charging points in the European Union increased by approximately 30% between 2024 and 2025.
The Alternative Fuels Infrastructure Regulation is one of the policies supporting high-power charging deployment along major European transport corridors.
For passenger cars and vans, AFIR establishes charging-infrastructure requirements along key sections of the trans-European transport network.
The United States also recorded faster-charging growth
The United States recorded a record number of new public charging points during 2025, according to the IEA.
The number added during the year was approximately 20% higher than the number added in 2024.
Fast and ultra-fast public charging points increased by approximately 30% to nearly 70,000.
The number of slower public charging points increased to more than 160,000.
Despite that growth, the United States still represents a relatively small share of the global public charging stock compared with its share of the global electric light-duty vehicle fleet.
Higher-power charging changes network operations
As charging networks become larger and more powerful, their operational requirements also increase.
A public charging point is not only an electrical device. Networked infrastructure generates charging-session records, meter data, payment events, status messages, diagnostics, firmware requirements and operational alerts.
At high-power charging locations, electricity capacity becomes an additional operational constraint.
Several DC fast chargers operating simultaneously can create substantial site demand, particularly when a charging hub contains multiple 150 kW, 350 kW or higher-power chargers.
As a result, charging-network software increasingly operates alongside site-level energy-management systems.
Operational functions increasingly relevant at scale
- Real-time charging-point monitoring
- Remote diagnostics
- Charging-session management
- Meter-data processing
- Payment and roaming interoperability
- Load balancing and power allocation
- Firmware and device lifecycle management
- Reliability and utilisation analytics
These software observations are industry analysis of the operational implications of larger connected charging fleets and should not be interpreted as conclusions directly stated by the IEA.
Not every EV can use the highest charging speeds
The growth of ultra-fast charging does not mean every electric vehicle can make full use of the highest available charger power.
The IEA notes that vehicle charging capability remains an important constraint.
In 2025, roughly 160 battery-electric car models were known to support charging speeds above 150 kW.
The number capable of charging above 250 kW was significantly smaller.
Charging performance can also be affected by battery temperature, battery state of charge and the vehicle’s charging curve.
This means rated charger power should not be interpreted as the charging speed every connected vehicle will continuously receive.
The market is moving beyond charger count
The latest IEA data show why the charging industry is increasingly using several metrics to evaluate infrastructure.
The number of charging points remains important, but network capacity also depends on charger power, geographic distribution, utilisation, reliability and the number of EVs supported by available charging capacity.
As public infrastructure expands, charging-network operators will increasingly need to manage both physical charging assets and the digital systems that coordinate them.
The 2026 outlook therefore points to a global public charging network that is becoming larger, faster and more operationally complex at the same time.
Sources & data note
Infrastructure figures in this article are based primarily on the International Energy Agency’s Global EV Outlook 2026. Software and operational observations are editorial analysis and are identified separately from IEA findings.
Primary source:
International Energy Agency — Electric Vehicle Charging, Global EV Outlook 2026
Official charging chart:
IEA — Global stock of public charging points by speed, 2020–2025
Image source:
U.S. Department of Energy — Alternative Fuels Data Center
DOE image-use policy:
U.S. Department of Energy — Web Policies

 EN_GB
EN_GB  EN
EN  ZH
ZH  AR
AR  DE
DE  ES
ES  KO
KO  JA
JA  IT
IT  FR
FR  VI
VI  MS
MS  ID
ID  FR_CA
FR_CA  NL
NL  SV
SV  TH
TH