
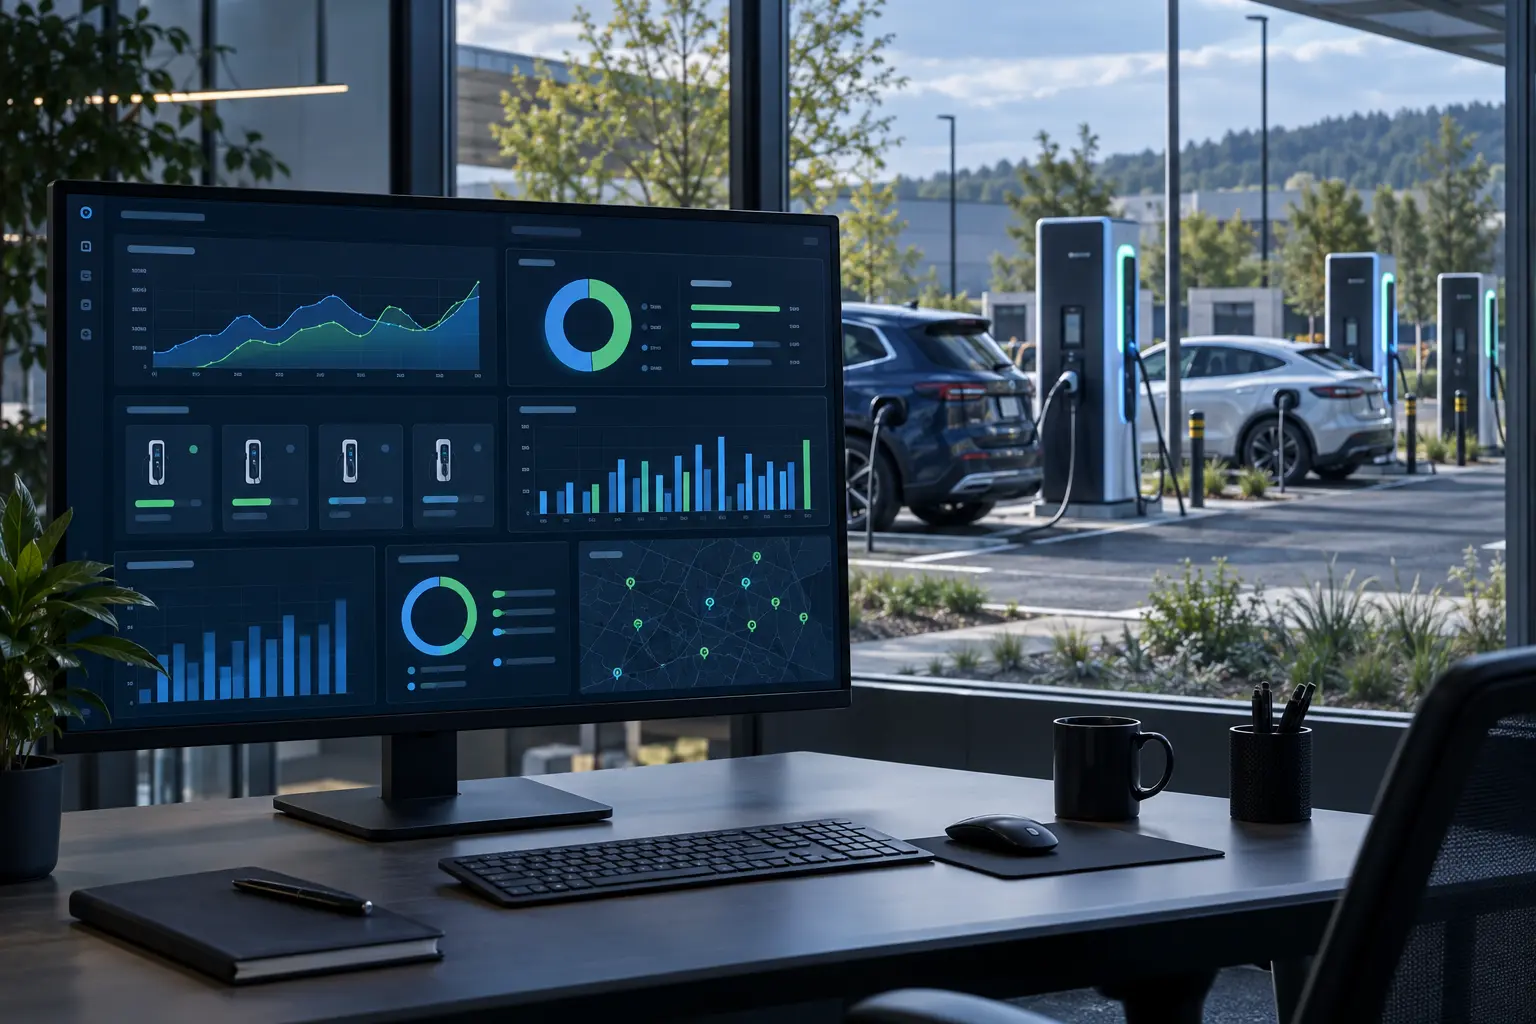
An effective EV charging station dashboard should tell a charging point operator what is working, what is failing, where revenue is being lost and what needs attention next. These 12 KPIs connect charger reliability, driver experience, commercial performance and energy demand in one operating view.
What Should an EV Charging Station Dashboard Show?
A useful CPO dashboard should combine four views: whether chargers are available, whether drivers can complete charging, whether stations produce sustainable revenue and whether sites stay within their energy constraints. A wall of charts is not enough. Every KPI needs a precise definition, an owner, a comparison period and a clear action when performance moves outside its expected range.
- Charging port uptime
- Real-time status accuracy
- Session start success rate
- Successful session completion rate
- อัตราการใช้งานเครื่องชาร์จ
- Energy delivered and average session energy
- Revenue per connector and site
- Payment authorization success rate
- Fault and repeat-fault rate
- Mean time to acknowledge and repair
- Remote resolution rate
- Peak demand and load-management performance
These metrics should sit inside the same operational layer that manages chargers, sessions, tariffs, payments and maintenance. TrendPower’s ระบบจัดการจุดชาร์จรถยนต์ไฟฟ้า connects those workflows so operators can move from a KPI to the affected site, charger, connector, transaction or incident without rebuilding the investigation in spreadsheets.
Organize EV Charging KPIs Into Four Decision Layers
Different teams need different answers from the same data. A network operations manager may start with offline connectors and recurring fault codes, while a commercial director may start with revenue per site. Keep one governed data model, then prioritize the dashboard by role.
Prioritize uptime, session success, utilization, energy delivered and revenue per connector. Add trends by region and site portfolio.
Prioritize offline ports, status accuracy, fault rate, repeat faults, MTTA, MTTR and remote resolution.
Prioritize payment success, recognized revenue, refunds, settlement status and revenue by site, tariff and payment channel.
Prioritize peak kW, managed-load compliance, energy delivered, queue pressure and departure-readiness metrics for fleets.
ความน่าเชื่อถือ
Is the network online, correctly reporting status and able to start sessions?
Usage
How often are connectors used, and how much energy do they deliver?
ทางการค้า
Are charging and payment journeys converting into traceable revenue?
Energy & O&M
Can the team resolve faults and control demand without disrupting service?
Open standards help make these views possible. The พันธมิตรการชาร์จแบบเปิด describes OCPP as the communication protocol between charging stations and charging management systems; OCPP 2.0.1 adds device management, improved transaction handling, security and smart charging functions.
12 EV Charging Station Dashboard KPIs and How to Calculate Them
The formulas below are practical operating definitions. Before using them in contracts, compliance reports or partner settlements, document your data source, exclusions, time zone, status mapping and denominator. A KPI is only comparable when every team calculates it the same way.
Charging Port Uptime
Uptime measures the percentage of eligible time that a port is online and available for use or actively dispensing energy. Measure at port level before aggregating to chargers, sites or the whole network; a dual-port charger with one failed connector should not appear fully available.
((Eligible minutes − Countable outage minutes) ÷ Eligible minutes) × 100For U.S. federally funded infrastructure, 23 CFR 680.116 requires each charging port to achieve greater than 97% average annual uptime and defines specific excluded outage categories. Other markets and contracts may use different rules, so keep regulatory uptime separate from your stricter internal service-availability measure.
- Break down by charger model and firmware
- Show rolling 24-hour, 30-day and 12-month views
- Separate planned maintenance from unplanned downtime
Real-Time Status Accuracy
A connector can look available in an app while it is offline, blocked or unable to start a charge. Status accuracy compares the state shown to operators and drivers with the state confirmed by charger telemetry, transactions or field checks. This KPI protects the trustworthiness of the dashboard itself.
Matched status observations ÷ All validated observations × 100Monitor stale heartbeats, delayed status events, incorrect connector mappings and gaps between CPMS and roaming-channel data. The same federal rule above calls for real-time port status to be shared using terms defined by OCPI 2.2.1. The EVRoaming Foundation’s OCPI resources are the authoritative reference for OCPI versions and modules.
- Track stale-status duration
- Compare CPMS, driver app and roaming feeds
- Flag impossible status sequences
Session Start Success Rate
This metric asks whether a valid driver attempt becomes an active charging transaction. It exposes authorization, charger communication, vehicle handshake and payment-preauthorization problems that a basic uptime figure can miss.
Charging sessions successfully started ÷ Valid start attempts × 100Define a valid attempt carefully. Exclude accidental repeated taps and test events, but do not hide genuine customer failures. Segment by QR, RFID, app, Plug & Charge, roaming provider and remote-start channel. A falling success rate with stable uptime usually points to a workflow or integration problem rather than simple charger availability.
- Authorization method
- Vehicle and charger model
- Error stage and failure code
Successful Session Completion Rate
Start success measures the beginning of the journey; completion success measures whether the charging session ends according to the operator’s service definition. A completed session might require energy above a minimum threshold, a valid stop event and a charge detail record that can be billed and reconciled.
Sessions meeting the completion rule ÷ Sessions started × 100Separate driver-requested stops, vehicle-requested stops, zero-energy sessions, communication loss and emergency stops. Use both the ratio and the failure count: a small percentage at a high-volume site can still represent many frustrated drivers and lost transactions.
- Stop reason
- Energy band
- ระยะเวลาของเซสชั่น
- Site and connector
Charger Utilization Rate
Utilization shows how much of a connector’s available time is occupied or actively charging. It helps CPOs identify underused investments, capacity bottlenecks and the right time to expand a site. Do not combine “plugged in” time and “energy flowing” time without labeling the difference.
Occupied connector minutes ÷ Available connector minutes × 100Add an active-charging utilization view and hourly heat map. High occupancy with low energy transfer can indicate long idle dwell, power sharing, vehicle limitations or weak idle-fee policy. Low utilization may reflect poor location demand, discoverability, pricing, downtime or a site launched ahead of market demand.
- Hour and day of week
- Connector type and power class
- Occupied versus active charging
- Queue or turn-away events
Energy Delivered and Average Session Energy
Total kWh measures network throughput; average kWh per session shows the typical charging outcome. Review both because transaction growth can hide falling energy per session, while a small number of long fleet sessions can make a low-traffic site look productive.
Average session energy = Total delivered kWh ÷ Completed energy sessionsCompare meter data, transaction records and billed energy. Segment by AC/DC, site type, vehicle class and tariff period. Unexpected changes can signal meter-data gaps, derating, load-management constraints, seasonal behavior or changes in the customer mix.
- Total and average kWh
- kWh per connector per day
- Energy by tariff period
- Meter-to-bill variance
Revenue per Connector and per Site
Gross network revenue can rise simply because more chargers were added. Revenue per active connector and revenue per site show whether each asset is producing more or less value. Keep recognized charging revenue, taxes, pass-through energy costs, service fees, subscriptions and partner commissions in separate fields.
Recognized charging revenue ÷ Active connectors in the reporting periodPair revenue with utilization and energy cost. A busy site is not necessarily profitable if tariffs, payment fees, host revenue share or peak-demand charges consume the margin. TrendPower’s โซลูชันการชำระเงินสำหรับการชาร์จรถยนต์ไฟฟ้า connects session, tariff, transaction and settlement workflows for clearer commercial reporting.
- Site, connector and tariff
- Revenue per kWh and session
- Payment fee and refund impact
- Gross revenue versus contribution margin
Payment Authorization Success Rate
Payment success measures how often an eligible payment attempt is approved and passed into the charging workflow. It should be visible by gateway, card or wallet type, currency, market and failure code. Otherwise, a regional payment outage can disappear inside a network-wide average.
Successful payment authorizations ÷ Eligible authorization attempts × 100Separate authorization from capture, refund and settlement. A payment can authorize successfully but fail later in the transaction lifecycle. Alert on sudden deviations from the normal range for each provider, rather than applying one global threshold to every market.
- Gateway and payment method
- Country and currency
- Decline reason
- Authorization, capture and settlement stage
Fault Rate and Repeat-Fault Rate
Counting alarms alone rewards noisy chargers. Normalize faults by operating exposure, then distinguish unique incidents from repeated events generated by the same unresolved cause. A repeat-fault window—such as the same fault family returning after a temporary reset—helps identify issues that need a permanent fix.
Unique fault incidents ÷ Connector operating hours × 1,000Rank fault families by affected sessions, downtime and recurrence, not only by raw event count. Compare charger model, firmware, component, site environment and installation cohort. TrendPower’s การจัดการปฏิบัติการอัจฉริยะ supports centralized monitoring, alerts, diagnostics and maintenance workflows.
- Severity and fault family
- Model and firmware
- First-time versus repeat event
- Downtime and sessions affected
Mean Time to Acknowledge and Mean Time to Repair
MTTA measures how quickly the responsible team acknowledges an incident. MTTR measures how long it takes to restore service after detection. Show the median and 90th percentile alongside the mean because a small number of long incidents can distort the average.
MTTA = Σ(acknowledged − detected) ÷ incidents
MTTR = Σ(restored − detected) ÷ resolved incidents
Pause rules should be explicit: waiting for spare parts, site access or utility restoration may belong in a separate status, but the dashboard should still expose the total customer-facing outage. Break MTTR into detection, triage, dispatch, repair and verification stages to show where the delay occurs.
- Median and P90
- Severity and ownership team
- Remote versus field repair
- Elapsed versus active work time
อัตราความละเอียดระยะไกล
Remote resolution rate shows how many incidents are restored without an on-site visit. It is a useful indicator of diagnostic coverage, remote-command effectiveness, charger integration quality and operating cost—provided that temporary resets are not counted as permanent resolutions when the same fault returns.
Incidents resolved without site visit ÷ All resolved incidents × 100Track the remote action used, restoration verification and recurrence within the chosen observation window. A higher rate is valuable only when session success and repeat-fault performance also improve. The goal is reliable restoration, not merely fewer dispatches.
- Remote command type
- Fault family
- Verified restoration time
- Repeat fault after remote action
Peak Demand and Load-Management Performance
Peak demand shows the highest site load during a reporting interval. Load-management performance shows whether the system stayed within the configured site limit while delivering the energy required by drivers or fleet schedules. Displaying only peak kW can hide service degradation caused by excessive throttling.
Intervals within configured site limit ÷ Controlled intervals × 100Pair site peak, available capacity, allocated power, requested power and delivered energy on the same time axis. For fleets, add the percentage of vehicles reaching their required state of charge before departure. TrendPower’s โซลูชันการจัดการการชาร์จรถบัส coordinates charging priority, vehicle readiness and depot power capacity.
- Peak kW and tariff period
- Requested versus allocated power
- Site-limit violations
- Fleet energy-ready by departure
Turn Dashboard Metrics Into Actionable Operating Rules
A dashboard should distinguish a long-term target from a real-time alert. Targets support performance management; alerts support incident response. Use network history, charger capability, operating hours, contract commitments and local regulation to set thresholds. Except where a rule or SLA applies, avoid copying a universal benchmark from another network.
| KPI group | Dashboard signal | First diagnostic question | Typical owner |
|---|---|---|---|
| ความน่าเชื่อถือ | Uptime or status accuracy falls below the agreed target | Which model, site or firmware cohort explains the change? | การดำเนินงานเครือข่าย |
| Driver journey | Start or completion success drops from its normal range | At which step and authorization channel do attempts fail? | Product + O&M |
| ทางการค้า | Utilization rises but revenue per connector falls | Did tariff mix, discounts, fees or energy cost change? | Commercial + finance |
| การชำระเงิน | One market or gateway shows a sudden decline | Is the failure at authorization, capture or settlement? | Finance + integration |
| การซ่อมบำรุง | Fault recurrence or P90 repair time increases | Are temporary resets masking a common root cause? | การดำเนินงานและการบำรุงรักษา |
| พลังงาน | Site peak rises or vehicles miss readiness targets | Did demand, site limits or charging priorities change? | Energy + fleet operations |
How to Build a CPO Dashboard That Teams Actually Use
Start with an executive summary
Show five to eight headline KPIs, their change versus the comparison period and the number of assets affected. Avoid mixing percentages and counts without labels.
Add an exception queue
Place offline ports, failed sessions, urgent faults, payment incidents and site-limit risks above exploratory charts. Let users sort by severity, customer impact and elapsed time.
Make every chart drillable
Move from network to region, site, charger, connector, session and event log. Preserve filters so the operator can investigate without losing the original context.
Use comparable time windows
Support live status, today, yesterday, rolling 7 days, rolling 30 days and custom periods. Compare equivalent operating hours and account for seasonality.
Expose data freshness
Show the last heartbeat, last successful synchronization and any delayed upstream feed. A dashboard should never present stale data as live.
Design role-based access
Give operators, site hosts, finance teams and partners the metrics they need without exposing data outside their responsibility or commercial scope.
Network summary → exception queue → trend comparison → site ranking → charger detail → session, payment or fault record.
If your team still exports several systems before it can explain one failed transaction, the problem is not a lack of charts—it is disconnected operational data. A configurable EV charging management system dashboard should connect device events, charging sessions, users, pricing, payments, revenue and O&M records through a consistent identity model.
How KPI Priorities Change Across Real Charging Operations
The 12 KPIs form a common operating language, but their priority changes with the business model. TrendPower’s published project cases show why a public CPO, a logistics charging network and a bus depot should not use the same default dashboard.
Longqi Power connected charging network
Connecting self-operated and third-party stations with truck fleets, VIN-based charging, vehicle data, route planning and centralized payments makes utilization, station availability, session energy and revenue visibility especially important.
Read the Longqi Power case →Schedule-aware smart bus charging
When each vehicle has a required departure time, the dashboard must combine charger availability, SOC, charging priority, peak load, faults and energy-ready-by-departure performance.
Read the Singapore e-bus case →OCPP, payment and multilingual operations
A new-market rollout needs visibility across OCPP connectivity, connector status, start success, localized payment performance, sessions, station activity and future multi-site growth.
Read the Bolivia platform case →Explore more EV charging software case studies, or review TrendPower’s dedicated heavy-duty truck charging platform for fleet-oriented operating workflows.
EV Charging Dashboard Implementation Checklist
Turn charging data into decisions your team can act on.
Share your charger models, network scale, markets, payment requirements and reporting priorities. TrendPower can demonstrate relevant CPMS workflows for your project.
EV Charging Station Dashboard FAQ
What is an EV charging station dashboard?
An EV charging station dashboard is an operator interface that combines charger and connector status, sessions, users, tariffs, payments, revenue, faults, maintenance and energy data. It helps a CPO monitor network performance and move from a high-level KPI to the affected asset or transaction.
What is the most important KPI for a CPO?
No single KPI is sufficient. Uptime is essential, but a charger can be online while drivers still fail to start or complete sessions. At minimum, monitor uptime together with status accuracy, session success, utilization, payment success, fault response and energy performance.
How is EV charger uptime calculated?
A practical formula is eligible minutes minus countable outage minutes, divided by eligible minutes, multiplied by 100. Regulatory and contractual definitions may specify exclusions, operating hours and aggregation periods, so document the exact rule used.
What is the difference between uptime and charging success rate?
Uptime measures whether a port is online and available under a defined rule. Charging success rate measures whether a real driver attempt starts or completes successfully. Authorization, payment, vehicle handshake or transaction problems can reduce charging success even when uptime remains high.
How often should CPO dashboards update?
Operational status, urgent faults and active-session information should update close to real time according to the charger, protocol and integration design. Financial settlement and long-term trend reports can update less frequently. The interface should always display data freshness.
Can one dashboard monitor chargers from different manufacturers?
Yes, when the chargers use compatible protocols and supported interfaces. Multi-brand monitoring still requires charger-model and firmware validation because different manufacturers can implement the same protocol version differently.
Which dashboard metrics matter most for fleet and bus charging?
Fleet dashboards should add vehicle readiness, required energy before departure, charging queue status, requested versus allocated power, peak site demand and schedule adherence to the core reliability, session and maintenance KPIs.
How can a CPMS improve dashboard data quality?
A CPMS can connect charger telemetry, status events, sessions, meter values, user authorization, tariffs, payments and maintenance records through consistent charger, connector and transaction identifiers. Good data governance and integration testing are still required.
Build the Dashboard Around Decisions, Not Decoration
The best EV charging station dashboard does not try to display every available field. It establishes a reliable chain from network health to driver outcome, commercial impact and corrective action. Start with the 12 KPIs above, agree the definitions, validate the source data and give every alert an owner. Then adapt the dashboard to the operating model—public CPO, fleet, bus depot, residential network or localized regional platform.
See how TrendPower connects charger monitoring, sessions, billing, payments and O&M in one CPMS →
 TH
TH  EN
EN  ZH
ZH  AR
AR  DE
DE  ES
ES  KO
KO  JA
JA  IT
IT  FR
FR  VI
VI  MS
MS  ID
ID  FR_CA
FR_CA  NL
NL  SV
SV  EN_GB
EN_GB